


Hazards and Population Mapper

توضیحات Hazards and Population Mapper
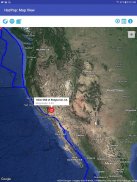
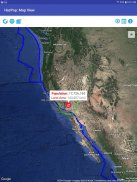
Hazards and Population Mapper (HazPop) is a free app that enables users to easily display recent natural hazard data in relationship to population, major infrastructure, and satellite imagery. Hazards data include the location of active fires over the past 48 hours; earthquake alerts over the past seven days; and yesterday′s air pollution data measured from space. The app shows the location of major dams and nuclear power plants and provides more detailed information and imagery for these facilities where available. By drawing a circle around a point or area of interest on the map, users can obtain an estimate of the total population and land area enclosed within.
Developed by the NASA Socioeconomic Data and Applications Center (SEDAC) operated by the Center for International Earth Science Information Network (CIESIN) at Columbia University, HazPop combines data and map layers from various sources including NASA's Global Imagery Browse Services (GIBS), the U.S. Geological Survey (USGS), and others using a variety of open Web mapping services. The custom population estimates are provided by the SEDAC Population Estimation Service (PES) based on SEDAC′s Gridded Population of the World, version 4 (GPWv4) data for 2015.
HazPop is designed to be used by disaster risk managers, humanitarian response organizations, public health professionals, journalists, and others needing a quick assessment of the potential dangers posed by a major hazardous event or developing emergency. For example, a disaster response agency can obtain a rough estimate of the population and major facilities near a recent earthquake as an input into response planning. Journalists or students can explore the location of recent wildfires relative to dense populations, roads, terrain, and water bodies. Due to the coarse resolution and varying quality of some of the data, HazPop is not intended to support in-depth risk assessment or location-specific response needs.
نقشه ها و نقشه های جمعیت (HazPop) یک برنامه رایگان است که کاربران را قادر می سازد تا به راحتی داده های خطرناک طبیعی را در ارتباط با جمعیت، زیرساخت های عمده و تصاویر ماهواره ای نمایش داده شود. داده های خطر شامل محل آتش سوزی فعال در 48 ساعت گذشته می باشد. هشدار زلزله در هفت روز گذشته؛ و داده های آلودگی هوا دیروز از فضا اندازه گیری می شود. این برنامه محل سدهای اصلی و نیروگاه های هسته ای را نشان می دهد و اطلاعات دقیق و تصویری را برای این امکانات که در دسترس است فراهم می کند. کاربران با برداشتن یک دایره در اطراف نقطه یا ناحیه مورد علاقه روی نقشه، میتوانند برآوردی از کل جمعیت و زمین را در داخل محصور بدست آورند.
HazPop که توسط مرکز داده ها و برنامه های کاربردی اجتماعی و اقتصادی ناسا (SEDAC) توسط مرکز اطلاعات شبکه بین المللی علوم زمین (CIESIN) در دانشگاه کلمبیا اداره می شود، داده ها و نقشه های لایه های مختلف را از منابع مختلف از جمله خدمات جستجوی بین المللی ناسا (GIBS)، ایالات متحده سازمان زمین شناسی (USGS) و دیگران با استفاده از انواع خدمات وب نقشه برداری باز. برآورد جمعیت سفارشی توسط خدمات ارزیابی جمعیت SEDAC (PES) براساس داده های SEDAC در جدول جمعیت جهان، نسخه 4 (GPWv4) برای سال 2015 ارائه شده است.
HazPop طراحی شده است که توسط مدیران ریسک فاجعه، سازمان های پاسخ دهنده بشردوستانه، متخصصان بهداشت عمومی، روزنامه نگاران و دیگران مورد نیاز است که نیاز به ارزیابی سریع خطرات احتمالی ایجاد شده توسط یک رویداد مهم خطرناک یا ایجاد اضطراری دارند. به عنوان مثال، یک سازمان پاسخگویی به فاجعه می تواند تخمین تقریبی جمعیت و امکانات عمده در نزدیکی زلزله اخیر را به عنوان ورودی در برنامه ریزی پاسخ بدست آورد. روزنامه نگاران یا دانش آموزان می توانند محل آتشسوزی اخیر را نسبت به جمعیت های متراکم، جاده ها، زمین ها و اقیانوس ها بررسی کنند. با توجه به وضوح درشت و کیفیت متفاوت برخی از داده ها، HazPop در نظر گرفته نشده است برای حمایت از درک عمیق ارزیابی ریسک و یا نیاز به پاسخ موقعیت خاص.
Hazards and Population Mapper - نسخه 1.0
(15-10-2019)
Hazards and Population Mapper - اطلاعات APK
نسخه APK: 1.0حزمة: edu.columbia.ciesin.hazpopآخرین نسخه Hazards and Population Mapper


اپلیکیشنها در دسته مشابه

شاید دوست داشته باشید...


